

Detector Media launches NewsBoard, an interactive tool for determining the quality of TV news
Detector Media launches NewsBoard, an interactive tool for determining the quality of TV news


On January 17th, 2022, Detector Media presented an interactive tool - NewsBoard. By following the link, users can view graphs with the analysis of TV news.
Today, both NewsBoard and the monitoring database are available in English.
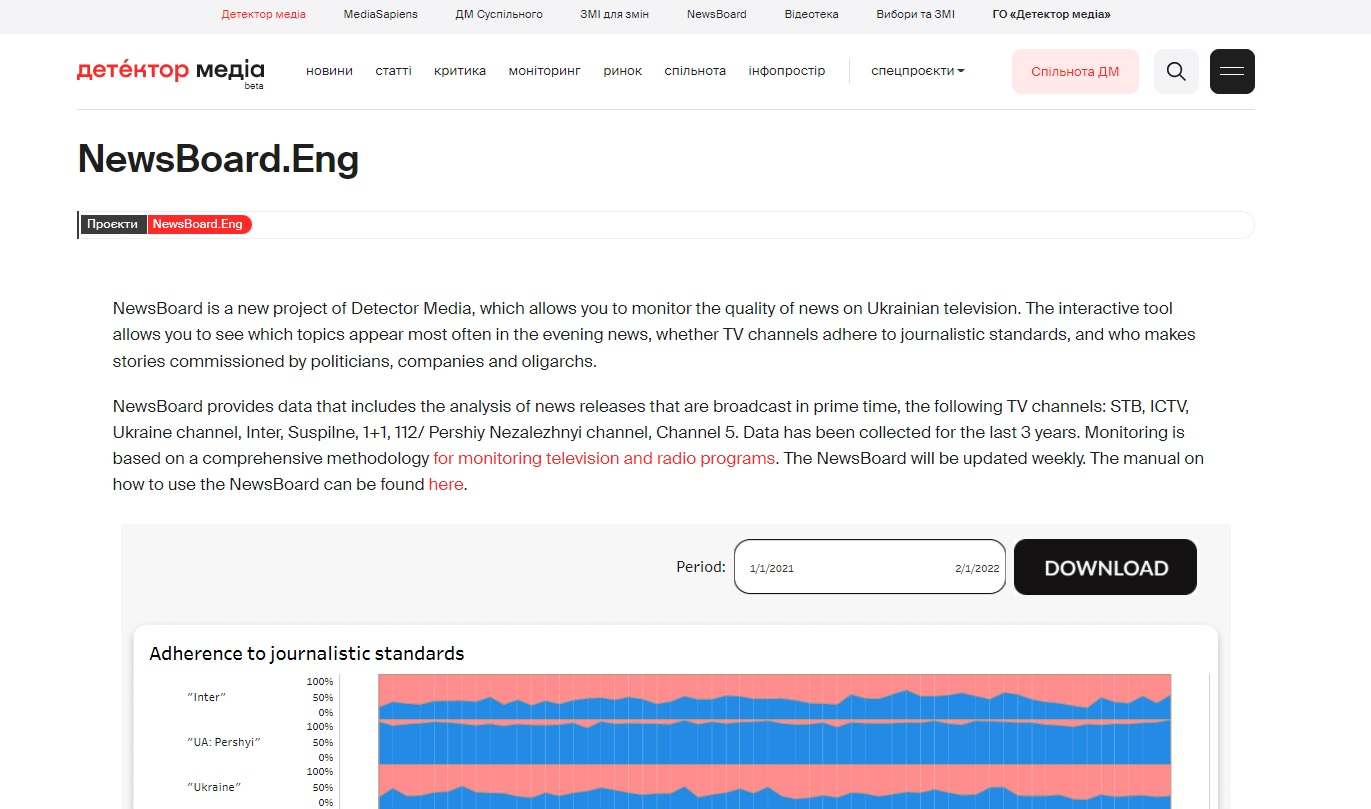
NewsBoard is a new Detector Media project, which allows assessing the quality of news on Ukrainian television. The interactive tool allows seeing which topics appear most often in the evening news, whether TV channels adhere to journalistic standards, and who makes stories commissioned by politicians, companies, and oligarchs.
NewsBoard has collected data that includes the analysis of news releases that are broadcast in prime time of the following TV channels: 1+1, Inter, ICTV, STB, Channel Ukraine, UA: Pershyi, Channel 5 and Channel 112 (since 2021 - Pershyi Nezalezhnyi). Data collected over the last three years is based on a large methodology for monitoring television and radio programs and is updated weekly.
NewsBoard also uses the elements of artificial intelligence and machine learning to further analyze the deciphered texts of major television newscasts, for example, to determine the tone of politicians' and authorities’ mentions. Detector Media continues to develop NewsBoard to expand the number of parameters and formats for data visualization. Possibly that in the future, the number of TV channels in the monitoring sample will be increased.
Who can use this resource?
NewsBoard will be of interest to all those who monitor the quality of information content on Ukrainian television. In particular, it will be helpful to the media community, journalists, professional non-governmental and human rights organizations, analysts, researchers, donors, and active representatives of civil society who seek to develop conscious consumption of media products.
The interactive panel provides a deeper analysis of the content consumed by Ukrainians on TV news and monitors the compliance with journalistic standards. That is why NewsBoard is a valuable tool for analysts, researchers, and professional journalistic organizations that control the quality of content in the Ukrainian media.
How to use it?
By following the link, users can view graphs with TV news analysis. All graphs are interactive, so hover over them for more information. The graph can be downloaded in PDF and Excel format for further use and detailed study.
The following graphs are available:
-
Adherence to journalistic standards
-
Compliance with standards: the dynamics of compliance with each standard
-
Materials with signs of “ordered information”
-
Who benefits from materials with signs of “ordered information”
-
Themes of materials
-
Most popular information
-
Materials from or about different regions of Ukraine
-
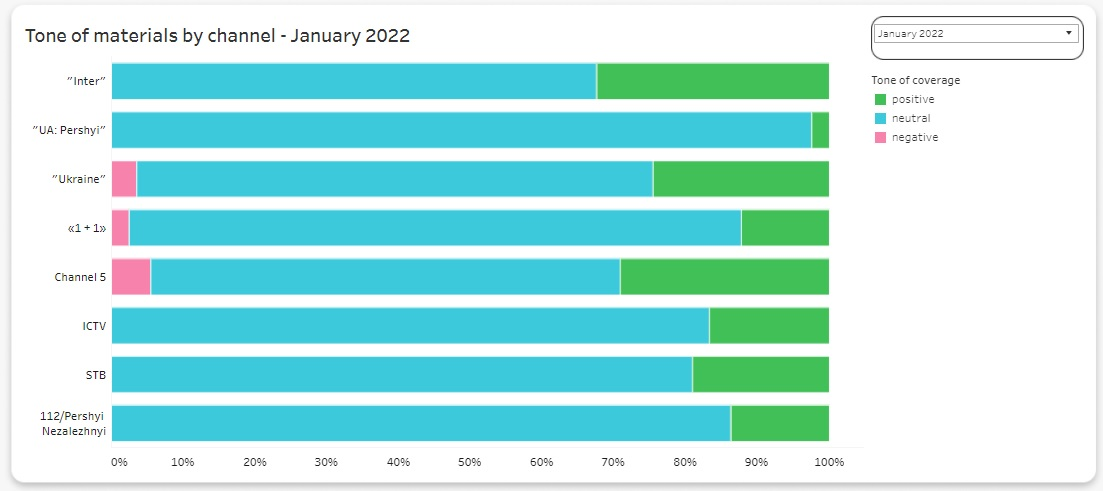
Tone of materials
-
How often a politician is mentioned on a specific TV channel
-
Tone of mentions by channel
-
Materials where parliamentary parties are mentioned - Data shown starting from August 29th, 2019
Graph 1 — Adherence to Journalistic Standards

By default, the first graph shows the ratio of the share of materials where all six journalistic standards are met and the percentage of materials where at least one is violated. The principles used in the analysis of compliance with these standards in television content are described in detail in the Methodology for Monitoring Television and Radio Programs of the Detector Media Non-governmental Organization (Section 2.1). The standards are as follows:
-
Completeness
-
Accuracy
-
Promptness
-
Separation of facts from comments
-
Reliability (references to sources)
-
Balance of opinions.
You can change the period for which the data will be displayed in the panel's upper right corner. At the moment, data from February 2018 to December 2021 are available for analysis. The data will be updated weekly.
Graph 2 — Compliance with Standards: The Dynamics of Compliance with Each Standard
Using the graph, you can track the dynamics of compliance with each standard. The graph allows you to compare the percentage of materials where a particular standard is violated with the total number of analyzed materials of the eight channels included in the sample.

Graph 3 — Materials with Signs of “Ordered Information”
On a pie chart, you can see the percentage of the channel's news in which there were signs of “ordered information”. The data are displayed for the last month by default, but users can select another month in the upper right corner. When you select a month, the pie chart is automatically updated.

Graph 4 — Who Benefits from Materials with “Ordered Information”
Detector Media analysts determine who benefits from materials with signs of “ordered information”. The markers of advertorial and the logic used to determine those who benefit from such materials are described in the Methodology for Monitoring Television and Radio Programs by Detector Media (Section 3).
By default, the graph shows ten politicians, parties, and/or organizations who benefited from the material with signs of “ordered information” on each channel in a particular month. In the upper right corner, you can select another month or increase the number of politicians, parties, and/or organizations for a specific period. On the right, there is also the list of top politicians, parties, and/or organizations that benefited from the material with signs of “ordered information” on all eight channels in a particular month. When you click on one of them, the share of the beneficial materials will be highlighted on the chart for each channel.

Graph 5 — Themes of Materials
The topics of materials are displayed for a particular month. The basic list includes the following groups: "Ukrainian politics", "international politics", "Ukrainian economy", "international economy", "religion", "crime", "emergencies", "the war in the Donbas", "Crimea", "social issues", and "culture". The list of thematic groups can be changed or expanded. On the right, there is a general list of the most popular topics. If you click on one of them, the share of materials on this topic will be highlighted on the graph.

Graph 6 — Topics of Materials
Two visualizations, located in parallel, reflect the most popular newsworthy events, i.e., short formulations of the critical points in the news stories covered in a particular TV material. By default, the five most popular newsworthy events are shown. You can increase their number in the upper right corner. You can also apply a “topic” filter to see in detail which newsworthy events predominate concerning a particular topic.

Graphs 7 and 8 — Materials from or about Different Regions of Ukraine and Tone of these Materials from Regions
You can see the number of materials in a particular month dedicated to events in certain regions on the displayed map. Several options can be chosen if a story contains information from the different regions. Materials for which it is impossible to determine association with a particular region are not shown on the visualization.


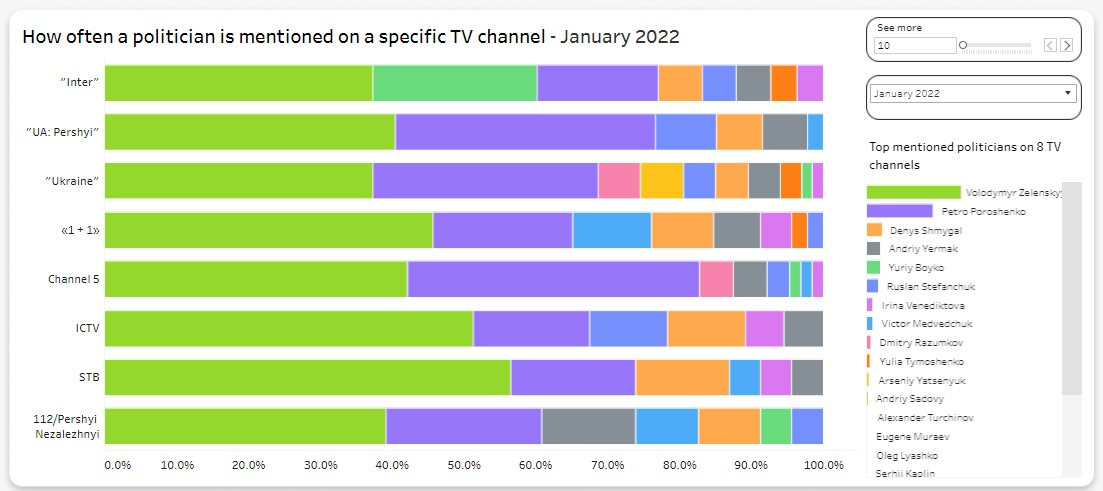
Graph 9 — How often a Politician is Mentioned on a Specific TV channel
The graph helps to compare the number of mentions of politicians in the materials on each TV channel in a particular month. You can change the number of politicians in the upper right corner. When you click on one of the politicians from the list, the share of materials where they are mentioned will be highlighted for each TV channel.
Graph 10 — Tone of materials by channel
Graph 11 — Materials where Parliamentary Parties are Mentioned
This graph shows which parliamentary parties (starting from 2019) are mentioned the most in the TV news of eight channels in a particular month. You can change the period in the upper right corner.

What is the advantage of this resource?
Instead of static information, users receive a tool that allows them to thoroughly explore the topic and obtain unique data in a few clicks.
Not only all collected information can be viewed, but it can also be exported in Excel and PDF formats so that you can continue to work with it outside the resource. This is especially useful for researchers in the Ukrainian media space. After all, this data can be used in their analytical work.
What is the aim of the project?
The project aims to help Ukrainians develop critical thinking and conscious media consumption.
The Detector Media team, who works on the project, is convinced that constant analysis and monitoring of television content encourages the journalistic community to create quality content and encourages viewers to decide which content to consume.
The NewsBoard was created by the NGO Detector Media within the framework of the Public Television Monitoring and Information Panel project under the auspices of the United States Agency for International Development (USAID).
The NewsBoard is based on the materials of monitorings carried out by the NGO Detector Media and its Monitoring Database, which was made possible due to the financial support of the United States Agency for International Development (USAID). It is provided through the project “Media Program in Ukraine”, implemented by the international organization Internews. The content of the materials is solely the responsibility of Detector Media and does not necessarily reflect the views of USAID, the US government, and Internews.